IRRIGATION MODELING EFFORTS
Understanding Irrigation Demand and Hydrologic Impacts

Understanding Irrigation Demand and Hydrologic Impacts
Rivers and streams play a vital role in Alabama’s economy and quality of life. Large amounts of water are needed to generate electricity from fossil fuels, nuclear power, and hydropower. Rivers also support transportation for coal and agricultural products. Many industries, such as pulp and paper mills, depend on reliable water supplies for processing and power. In addition, maintaining adequate river flows is essential for protecting water quality and meeting environmental standards. Communities across the state rely on rivers and streams to provide drinking water through public utility networks.
Beyond their economic value, rivers and streams matter deeply to residents of Alabama for their historical significance, recreational opportunities, and simple aesthetic enjoyment. To protect these shared benefits, it is important that irrigation needs are carefully managed so they do not harm other water users or the environment. This requires integrated agricultural, hydrologic, and regional water withdrawal models that can estimate agricultural water demand and understand how it affects stream flow.
These tools can also help estimate the costs and benefits of different water-management options. By using integrated models, decision-makers can evaluate how expanded irrigation has affected stream flows during past droughts, assess how future growth or changing climate conditions may impact water availability, and support more responsive, real-time water management. Experience in other parts of the country shows that the lack of such tools can lead to overuse and long-term damage to river systems.
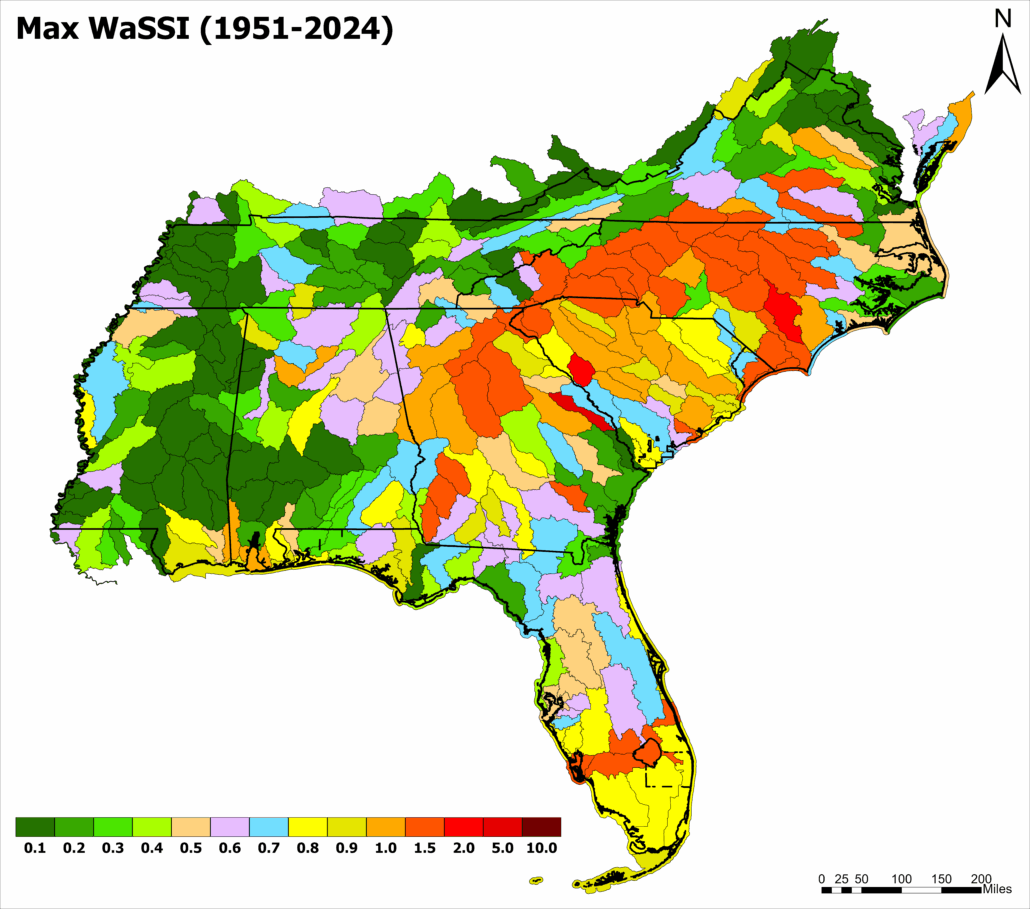
The hydrologic component of the integrated model is based on the Water Supply Stress Index (WaSSI), developed by the Eastern Forest Environmental Threat Assessment Center of the U.S. Department of Agriculture Forest Service (Sun et al., 2008; Caldwell et al., 2012). Within the model a water stress index is calculated for each watershed. This index is a ratio of the of the total water demand within a river basin to the total water supply available during a given period, including water that returns to the system after use. A larger index value indicates high water stress, and conversely, a lower index value signifies less water stress.
The WaSSI model currently covers the contiguous United States and operates at the 8-digit Hydrologic Unit Code (HUC) level. The model runs on a monthly time step. It combines a hydrologic model that estimates water supply with a demand module that calculates water use within each watershed.
The hydrologic model calculates a monthly water balance for ten different land-cover types within each watershed. It accounts for key processes such as evapotranspiration, infiltration, soil moisture storage, snow accumulation and melt, surface runoff, and groundwater contributions as baseflow. These calculations are based on detailed land-cover data from MODIS satellite observations. Streamflow discharge is then routed through the river network from upstream to downstream watersheds.
CAPTION

The Decision Support System for Agrotechnology Transfer (DSSAT) is a widely used crop model developed at the University of Georgia and the University of Florida by Dr. Gerrit Hoogenboom and Dr. Jim Jones, along with contributions from others such as Dr. Cheryl Porter and Dr. Ken Boote (Jones et al., 2003; Hoogenboom et al., 2010). DSSAT was designed to analyze agricultural productivity and environmental impacts at the field scale. However, evaluating crop yields and water use at watershed, state, or regional scales requires a spatially distributed modeling approach.
Early in the AUII, NASA funded the University of Alabama in Huntsville (UAH) to develop a gridded version of DSSAT using satellite-based data products. This system, known as GriDSSAT, runs the DSSAT crop model on a grid with a spacing of approximately 4.75 kilometers, matching the National Centers for Environmental Prediction (NCEP) Stage IV precipitation grid (McNider et al., 2011). Each grid cell is assigned a set of input data that defines its location, weather conditions, crop variety, soil characteristics, and management parameters.
Weather inputs, including temperature, solar radiation, and precipitation, are derived using established satellite and meteorological methods described by McNider et al. (2011). Soil information is based on profiles developed at the county level using the USDA Soil Survey Geographic (SSURGO) database, with dominant agricultural soils selected for each county.
Click here to add your own text