
Why Map Center Pivots?
Tracking the expansion of irrigation helps quantify water use, crop productivity, and watershed impacts. Additionally, it is important to know where withdrawals are occurring for use in crop models such as GriDDSAT and CropScape. Statewide totals tell “how much,” but spatial mapping shows “where” irrigation is actually happening.
In order to collect spatially accurate irrigation data, UAH proposed a study to the Alabama Office of Water Resources (OWR) to locate all center pivots in Alabama. While center pivots are not the only method for delivering irrigation, they are the preferred method of row crop irrigation and account for most of the irrigation water used in Alabama. This effort not only helps with water resource planning, drought preparedness, and agricultural decision making, but also helps quantify were irrigation is expanding and where infrastructure is being retired.
How Pivots Were Identified
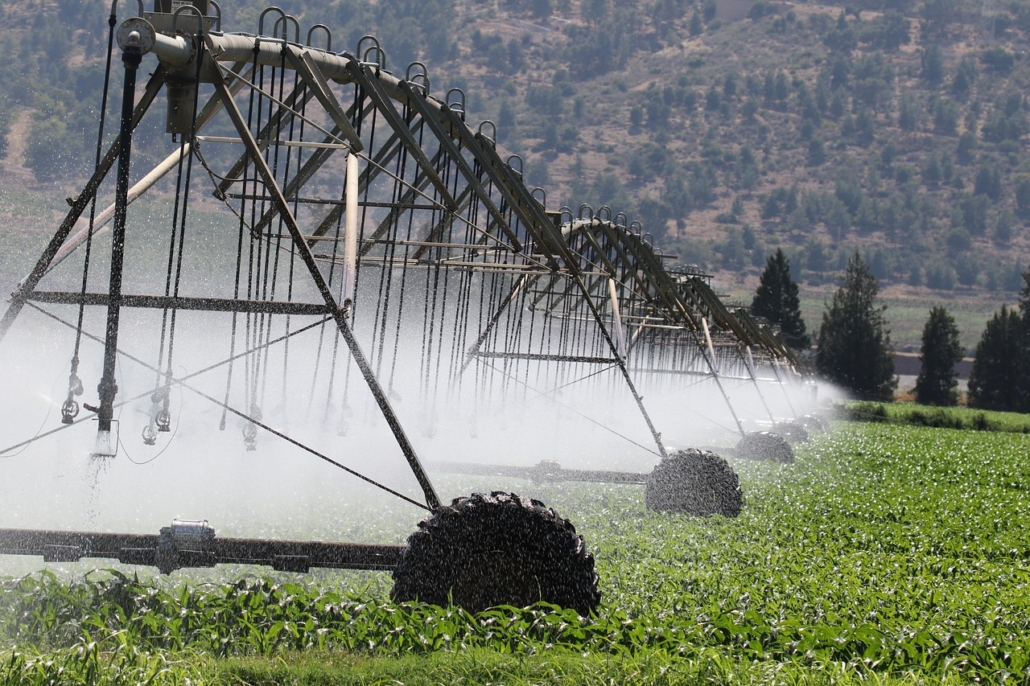
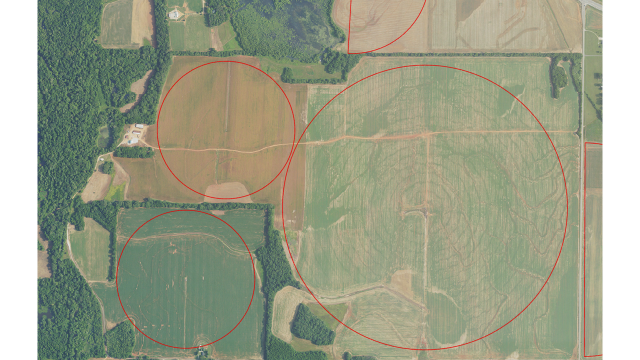
High-resolution USDA National Agricultural Imagery Program (NAIP) aerial imagery was visually interpreted to locate center pivot systems. This manual approach is more accurate in Alabama’s humid climate, where irrigated crops often blend in with surrounding vegetation, limiting automated detection methods. This approach involves a human analyst inspecting a digital image for irrigated areas and then manually digitizing polygons around those sites. The visual detection may use a pivot boom and pivot tracks rather than a circle to find pivots.
Trends Over Time
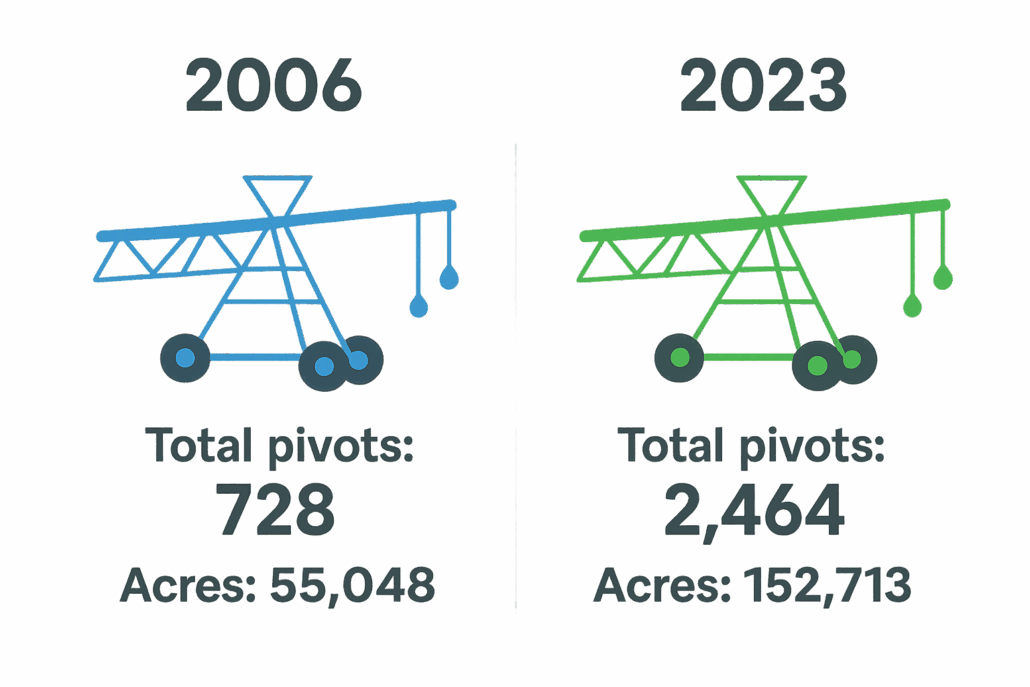
The center pivot surveys were conducted in 2006, 2009, 2011, 2013, 2015, 2017, 2019, 2021, and 2023. Over this period, center pivot irrigation in Alabama expanded substantially. From the initial 2006 survey to the most recent in 2023, the number of center pivots increased by 1,736 and irrigated acreage grew by 97,665 acres.
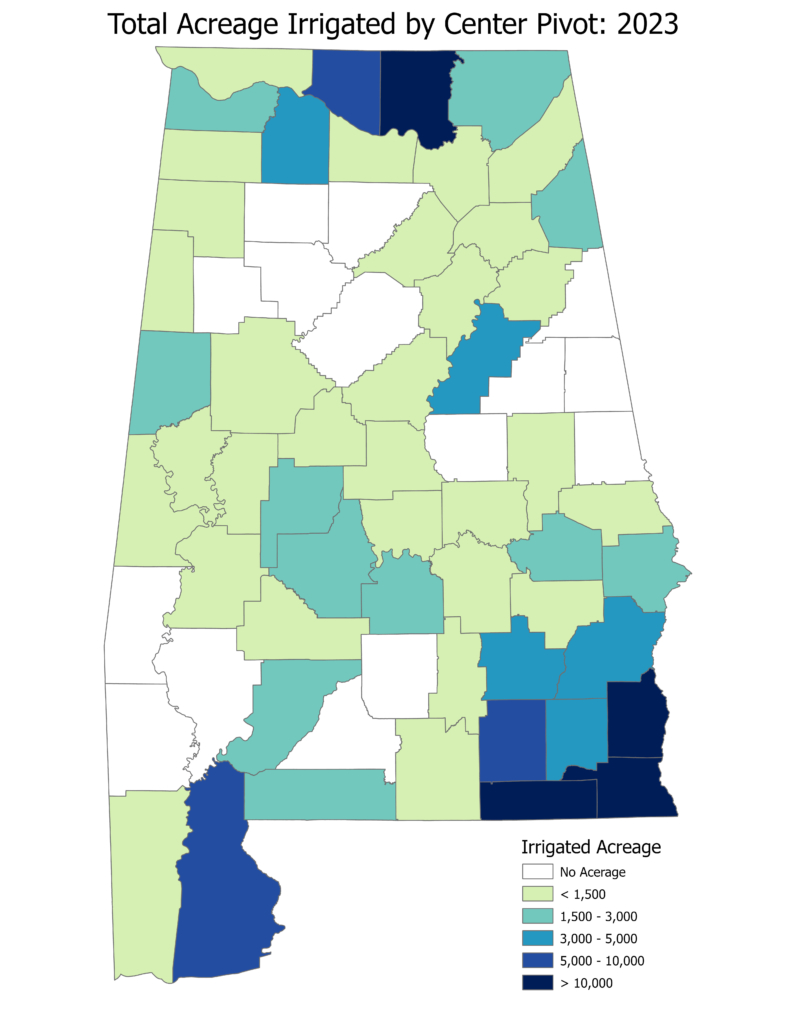
In recent years, the areas of highest increase in center pivots were North-Central Alabama and the Wiregrass Region. Some counties did experience pivot loss or coverage reduction between survey years, and this was often due to expansion of industrial or suburban areas.
Where is Irrigation Occurring?
The final products from each of the center pivot surveys provided exact location, acreage, and extent of center pivot irrigation in the state. These were combined into a comprehensive database that include data from the previous years as well as other agriculture related data like overall crop areas and crop types provide by USDA CropScape Cropland data layer.
The survey in 2023 identified 2,464 center pivots and 152,713 acres of irrigated farmland. The counties with the most irrigation were Houston, Limestone, Geneva, Madison, Henry, Baldwin, Lawrence, Coffee, Talladega, and Escambia.